Welcome to Imageryst!
In these documents you will find general instructions to use the platform. If you have any further questions, don't hesitate to write an email to your assigned Customer Success Representative.
Thank you for trusting Imageryst and welcome!
General:
Supported Formats
Georeferencing files: Imageryst supports KML/KMZ, GeoJSON, and DXF containing the polygon.
As-Built files: Imageryst supports .dxf and shapefile formats to upload as-built drawings and verify construction accuracy.
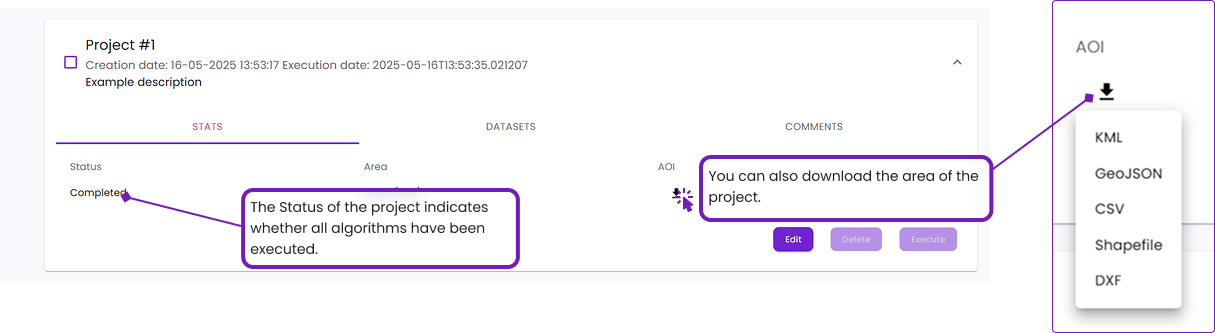
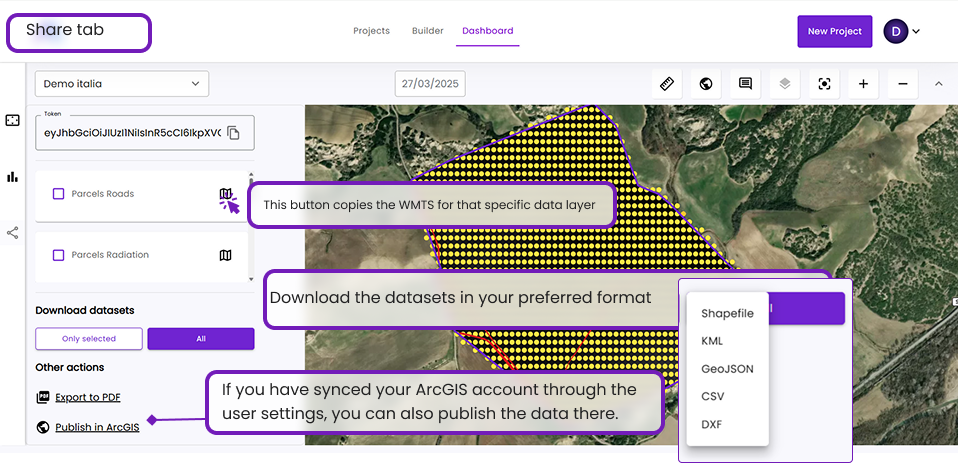
Download files: Imageryst supports Shapefile, KML, GeoJSON, CSV, and DXF. The maximum download size is 2GB of data. This can vary depending on the algorithm; some will weigh more than others. LiDAR algorithms will take longer due to the higher data load. Higher resolution and a larger area to download will result in longer download times.
Usage Recommendations
Check your internet connection before use. Imageryst does not currently have an offline mode. Project modifications might not save correctly if the connection is poor.
It's optimized for Google Chrome. Other browsers that work well: Opera, Edge, Brave. We do not recommend Firefox. The platform's performance may be diminished.
Available Data, Data Sources, & How We Process Them
Available Data Packages:
Land Analysis:
LiDAR-dependent algorithms. Dates may vary between 2014 and 2016:
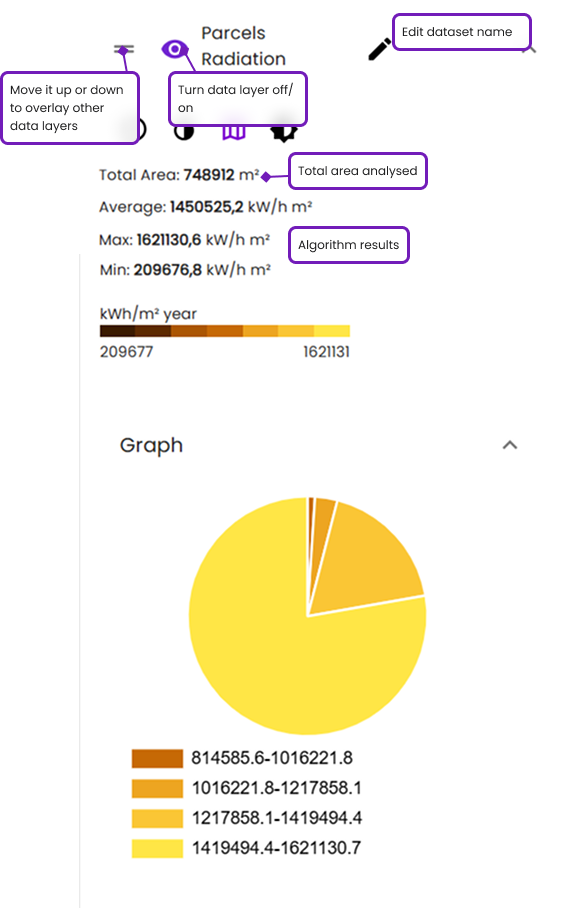
- Slope: Measures the slope in degrees of inclination and in %. It uses points. Imageryst provides the average, maximum, and minimum. This is a proprietary GDAL function.
- Radiation: Measures the average annual radiation per m² using points. We can see the total average for the area, as well as the maximum and minimum. We start with LiDAR data, and a buffer is generated because we use the surrounding environment to account for shadows. This gives the average radiation in that area. An external API call to PVGIS retrieves the radiation data. All data is intersected, and by applying building information, the radiation is calculated.
- Contour Lines: Measures altitude above sea level (m.a.s.l) via contour lines. We can see the total average for the area, as well as the maximum and minimum. This is a proprietary GDAL function using LiDAR.
- Altitude: Measures altitude above sea level (m.a.s.l) via points. We can see the total average for the area, as well as the maximum and minimum. Data is extracted from LiDAR.
- Aspect: Measures the orientation of the area in degrees, using points. Imageryst provides the average in degrees. This is a proprietary GDAL function.
Ad-hoc algorithms, processed through a purchased satellite image:
- Vegetation Health: Classifies the terrain based on vegetation density detected through NDVI.
- Burned Areas: Identifies m² of burned areas. We use the SWIR band from a specific satellite (Copernicus). The NBR index is calculated, values are combined, and the terrain is classified.
- Water Bodies: Identifies bodies of water, estimated depth, and area through NDWI.
- Soil Humidity: Classifies the terrain based on detected humidity through NDWI.
Through other methods:
- Roads: Identifies paved roads and some paths depending on the material. Provides m² of road. Deep Learning model, developed and owned by Imageryst.
- Lights: Identifies night luminosity intensity and types of lights. Classification through image values.
- Power Lines: Selected from another API. Allows us to distinguish power lines.
Work Monitoring:
These datasets have been specifically developed for this product.
-
Earthworks: Land classification based on multiple cross-referenced indices.
-
Panels: Deep learning model for panel detection.
-
Wind Turbines: Deep learning model for wind turbine detection.
-
Powerblocks: Deep learning model for powerblock detection.
-
Powerline supports: External API. Powerpass turbo OpenStreetMap.
-
Trenches: Deep learning model.
-
Vehicles: Deep learning model.
Interface and Managing Projects
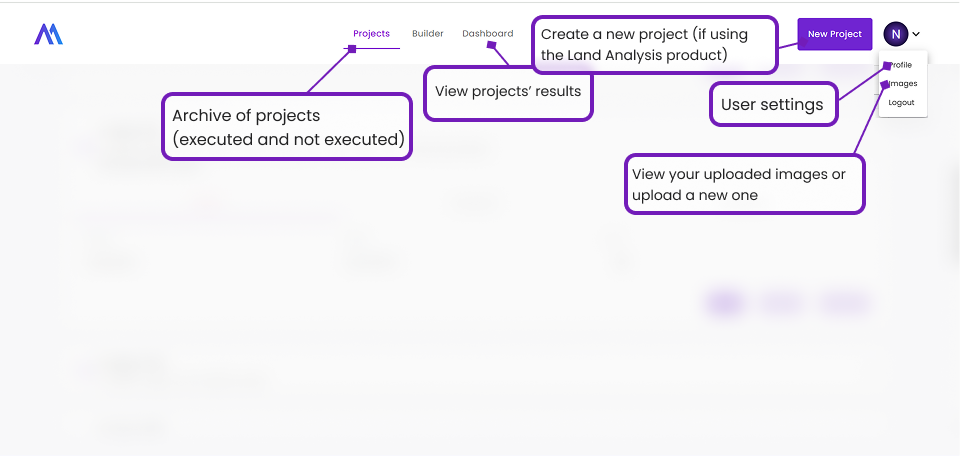
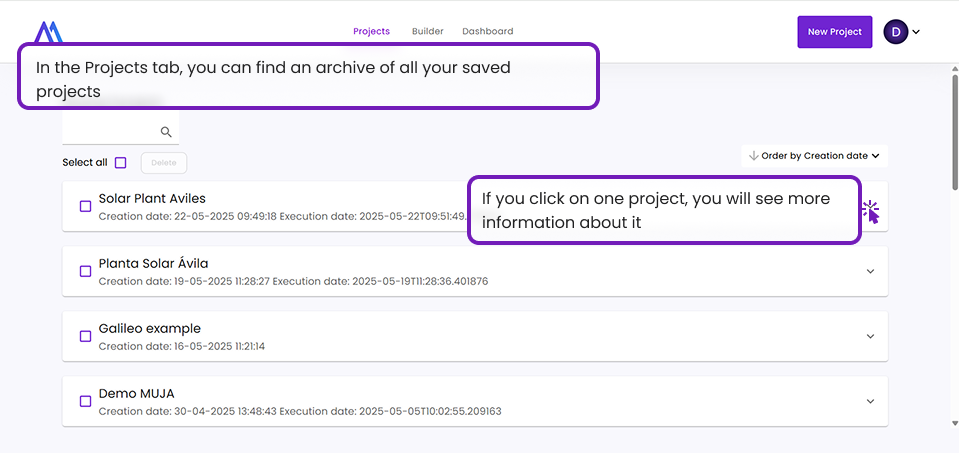
There are 2 main tabs to use in our web app: the Projects tab and the Dashboard tab. ‘Projects’ will help you manage, delete and edit all your executed analysis. We will dive into the Dashboard tab in another section.
User Configuration
Your account features will depend on the package you have chosen. We offer two types of services:
- Work Monitoring: For analyses with recurrent temporal comparisons between dates. Autonomous launching of projects is not available on current version, they will be generated internally by our Tech team.
- Land Analysis: For static analyses of a single date. Autonomous launching of projects is enabled. The amount of km² allowed for analysis will be limited based on contract.
Your User Profile
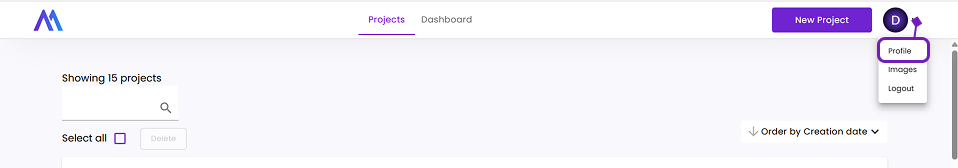
You can access your Profile through the dropdown menu on the right corner of the header.
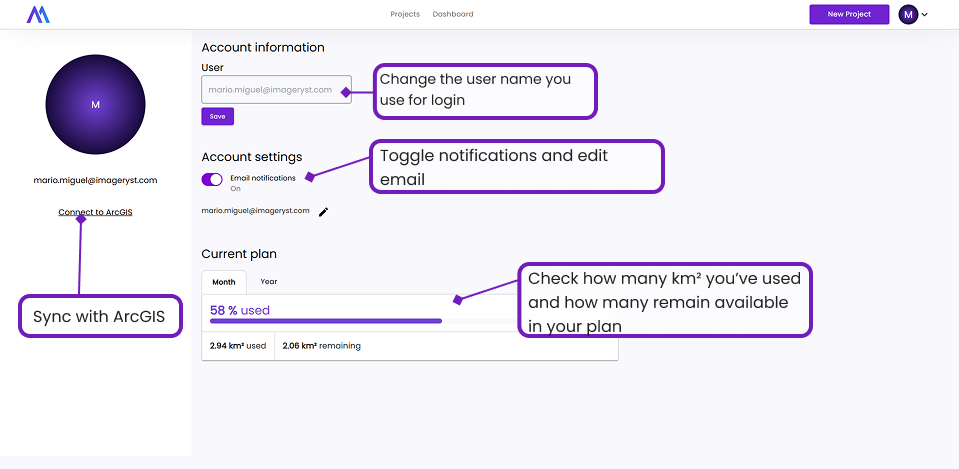
Syncing with ArcGIS
You can synchronize Imageryst data with your ArcGIS account. Each dataset is exported as an additional information layer. For this to work, you must enable synchronization with ArcGIS. Keep in mind that the session may expire and, if so, you will need to log back in.
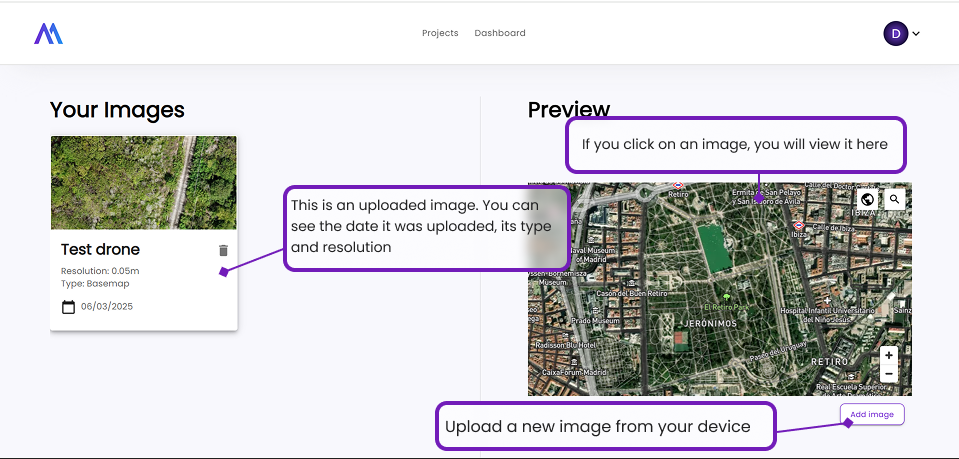
How to Upload Images - Image Gallery Explanation
Supported formats: images should be in .tif format, with RGB bands in that order (Red, Green, Blue).
Maximum size limits: for optimal performance, try for your area to be around 5km² or under.
Land Analysis
Create Projects
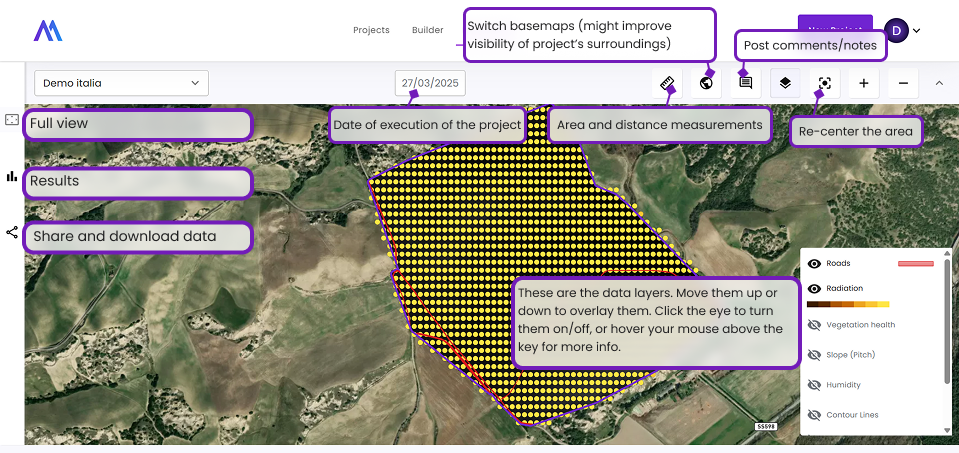
First, you'll need to name your project. Then, select the attributes you want to measure.
Next step: determine the area to analyze (the maximum area you can analyze will depend on your contracted package. If you need more area for a specific instance, please contact us).
With Your Own Image. File Specifications.
You can select a previously uploaded .tif image from your device into the Image Gallery tab, or upload it ad-hoc from your device.
With Your Own Area.
Once you have chosen the attributes you want to measure, you can upload your own georeferenced file. Imageryst supports KML/KMZ, GeoJSON, and DXF containing the polygon. Important: it cannot be a polygonZ; the file must not include a Z coordinate.
Searching for the Area using the Builder.
Once you have chosen the attributes, you can use the map on the right to search for an area. Select "Draw" and draw the outline of the area you want to analyze, clicking each time you want to change the line. When you have finished marking the entire polygon you want to analyze, you can press "enter," and it will be drawn. Select "Continue."
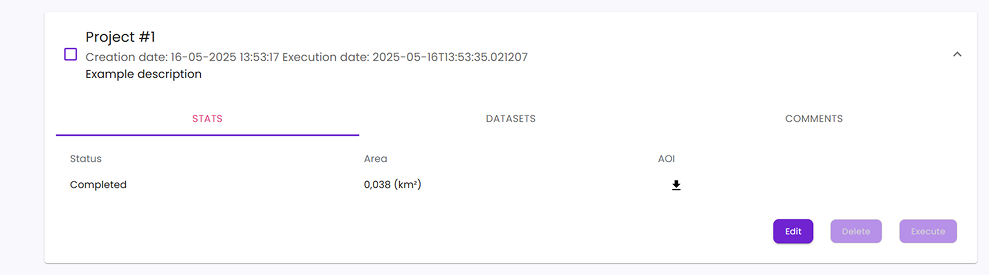
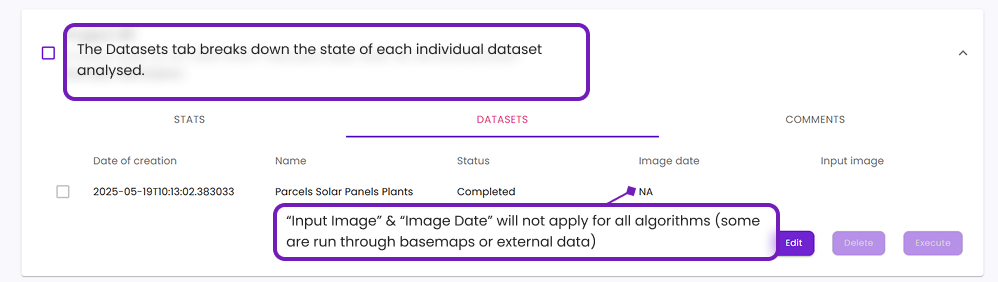
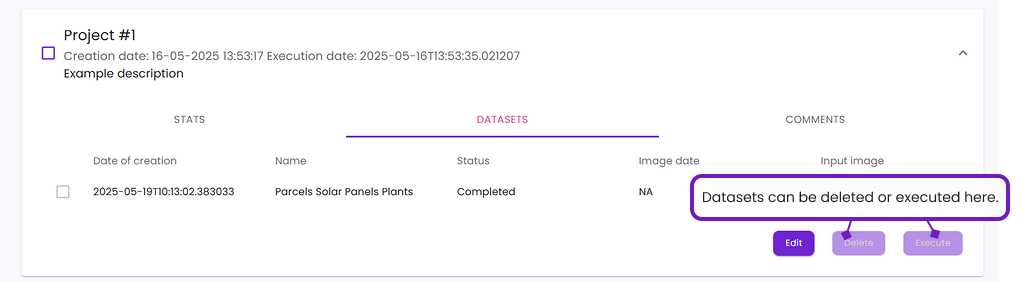
Once a project is created, if it has not yet been executed, you must select the project on the Projects tab and click "Execute". Algorithms that have not been executed will not be visible on the dashboard. In case of errors or excessive loading times (anything over 15’) for dataset execution, please contact us.
Geographical Limitations:
1m LiDAR is only available in Spain, Canary Islands, Balearic Islands, Poland, and the United Kingdom.
Performance Recommendations:
For 1m LiDAR analysis, we recommend a maximum area of 3km². The large amount of data can cause slow loading if this limit is exceeded.
Geometry algorithms like Humidity, Veg Health, Burned Areas, and Water Bodies perform optimally up to 10km². Beyond that, they may experience performance issues.
The object detection capability will always depend on the image resolution. Remember: "1m resolution" means 1 pixel = 1m. Therefore, a 1m element will occupy 1 screen pixel. Keep this in mind when visualizing your projects.
Project Analysis
Our Land Analysis tool enables you to extract detailed information about the state of a specific parcel of land.
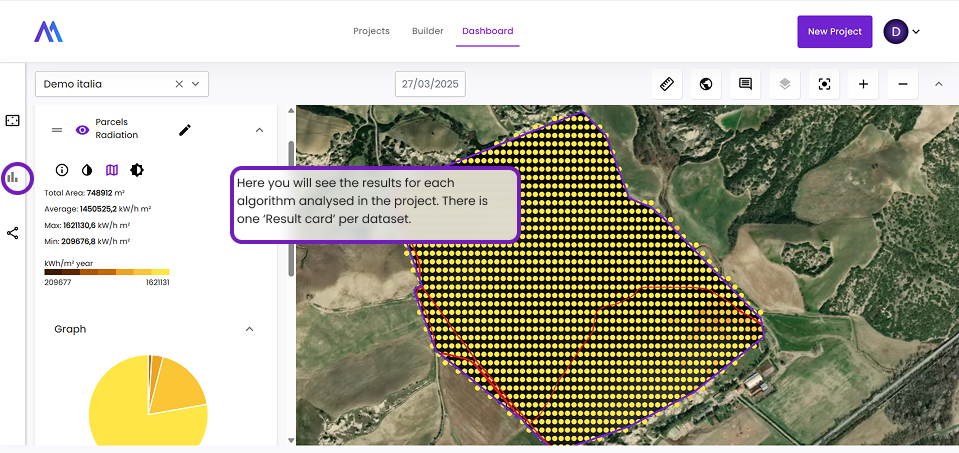
Results Cards and Their Functionalities
Work Monitoring
Project Analysis
All Tools: Measurements, Basemaps...
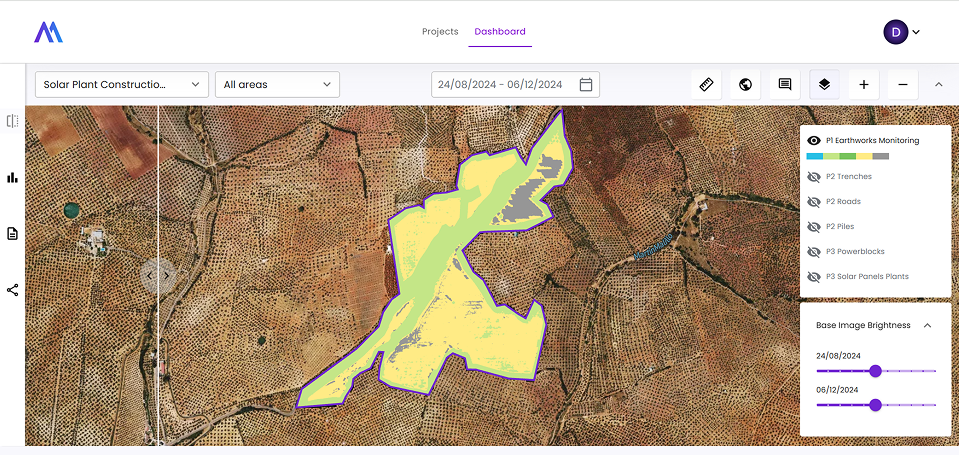
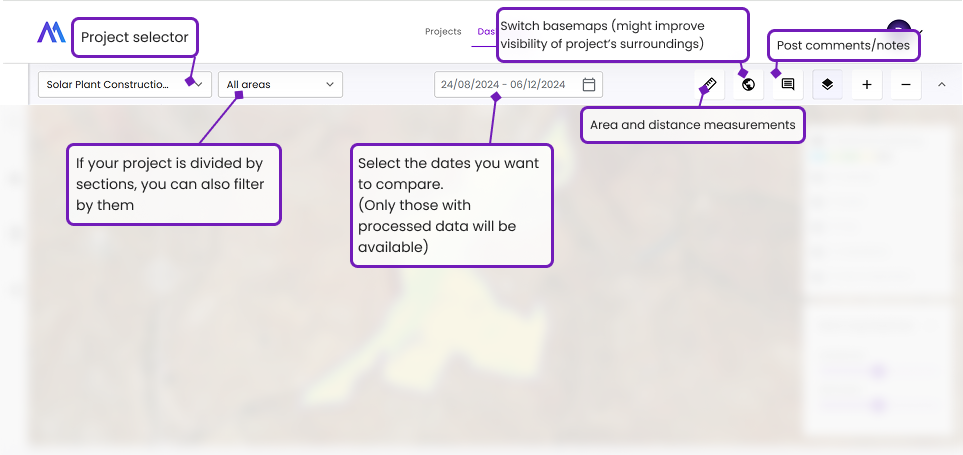
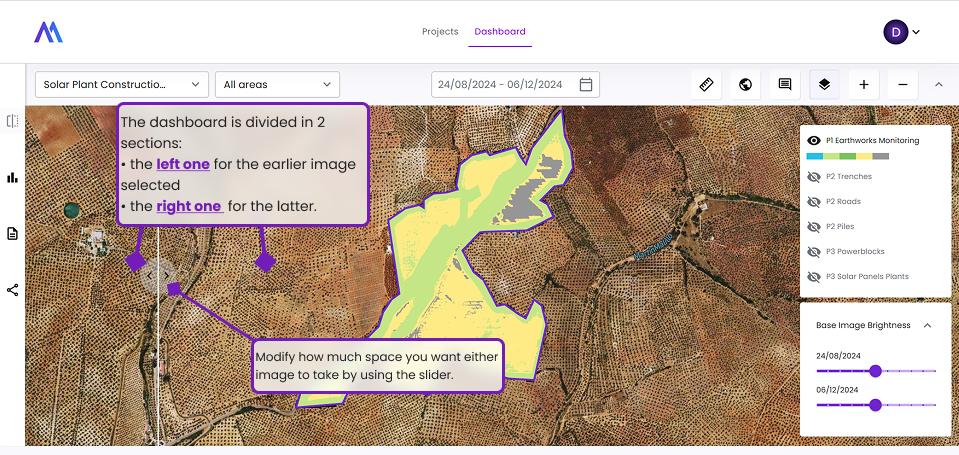
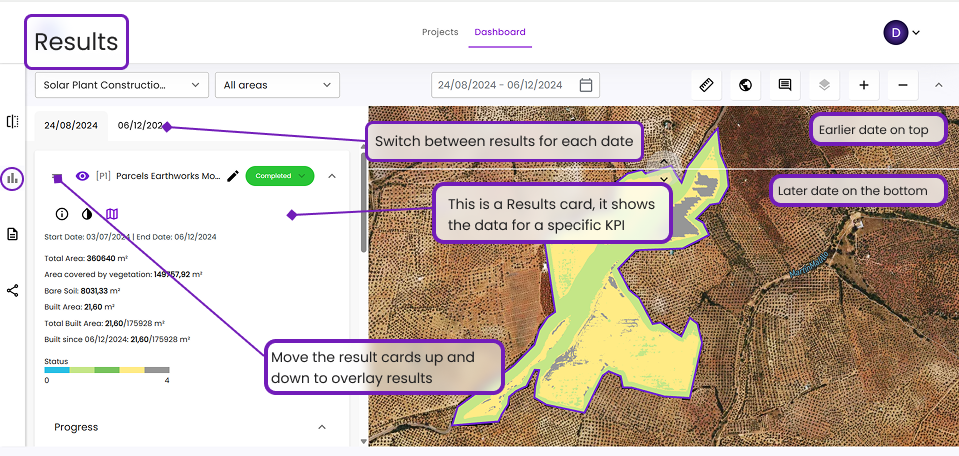
Work Monitoring is our 360 tool that aims to help you in your project planning and monitoring. There’s a dashboard which enables comparison among results in different dates:
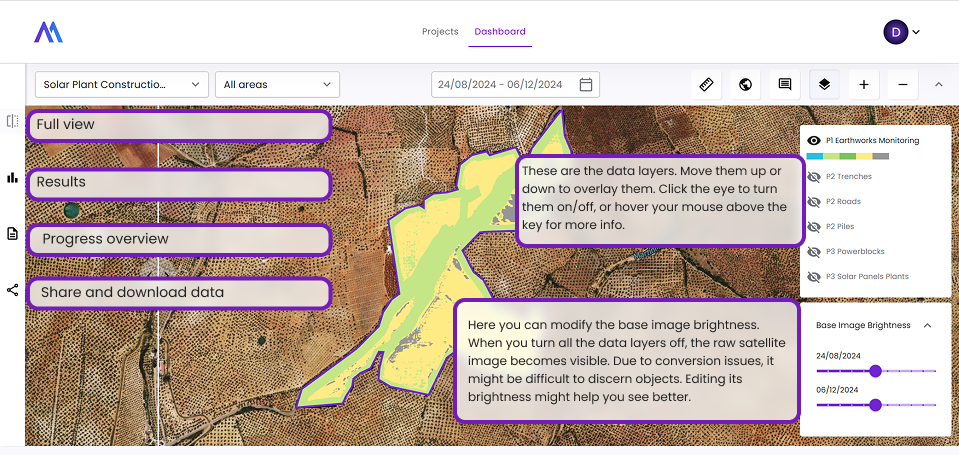
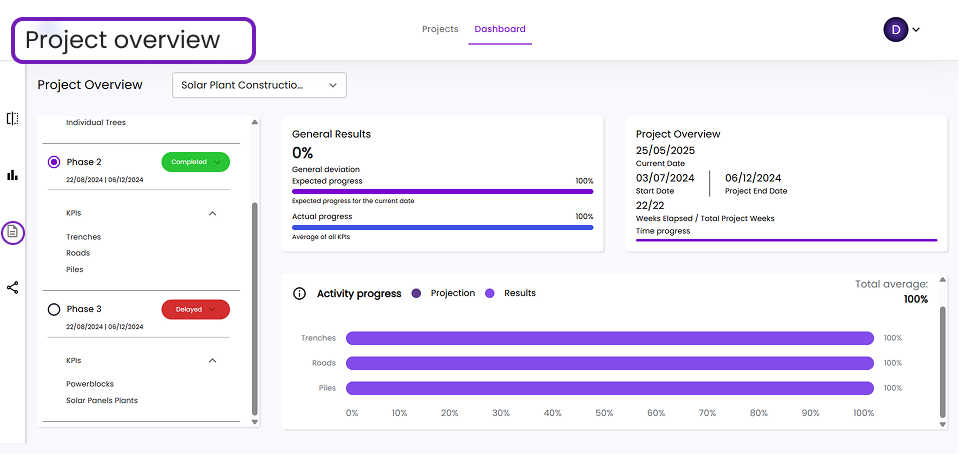
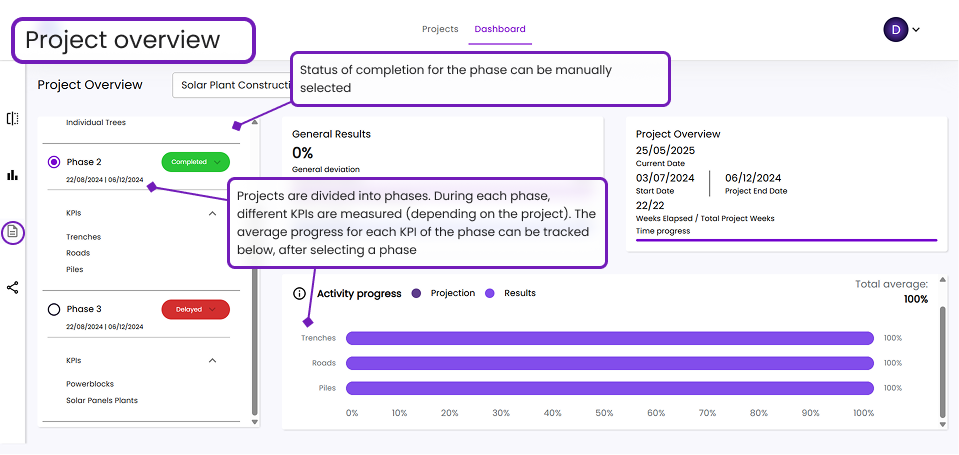
There’s also an ‘Overview’ tab, which is designed to help see the construction state at a glance:
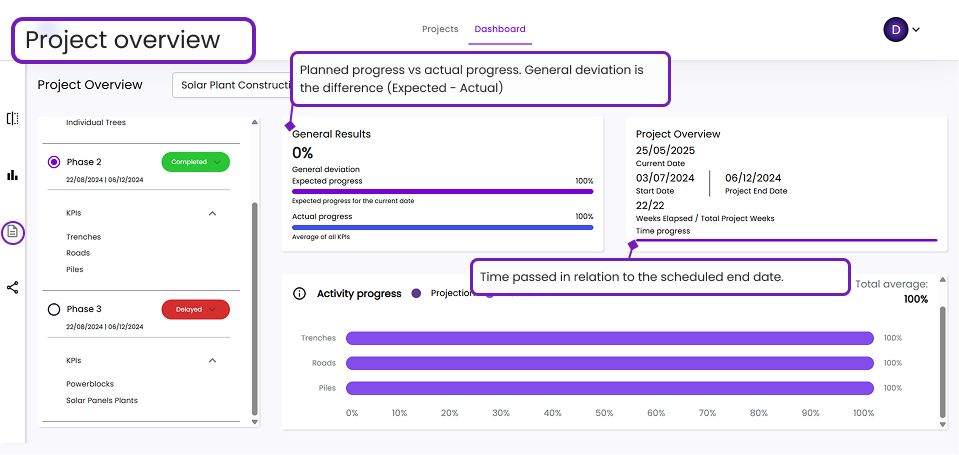
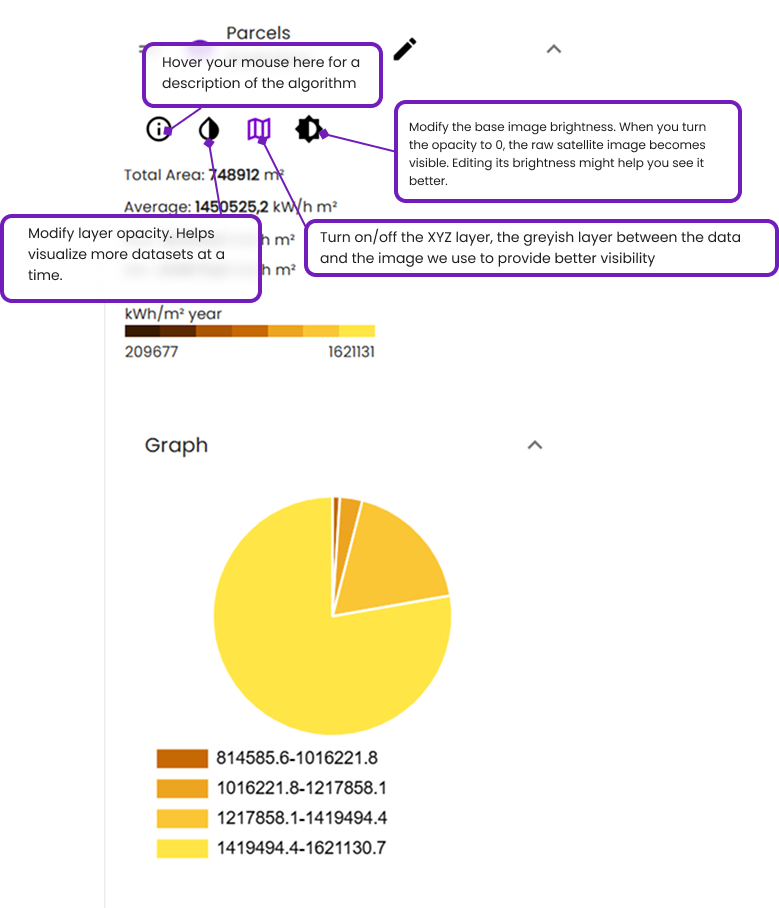
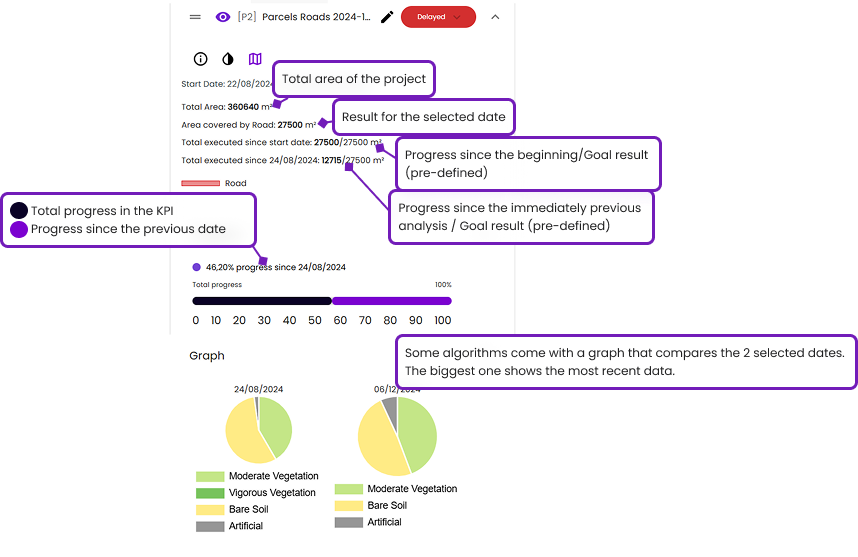
Results Cards
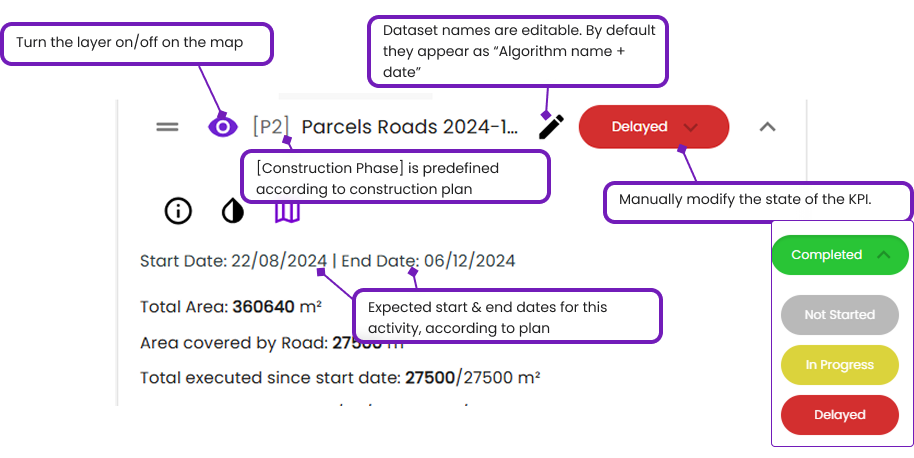
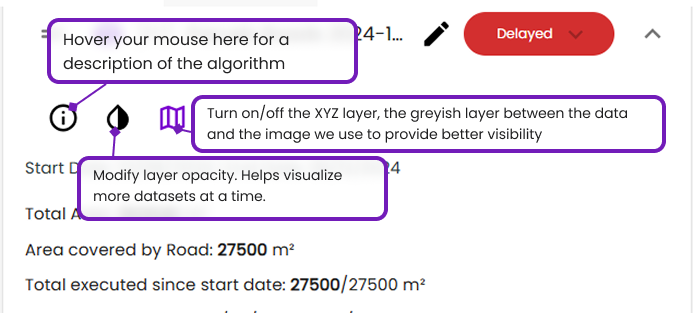
Each KPI analysed will be explained through a ‘Results’ card:
Share your results
To get the most out of Imageryst, we encourage you to use it as a collaborative tool. The Share tab enables you to download, export and share all the data in multiple formats:
Observations
For the Work Monitoring data to be accurate, we will need your data input to be as accurate as possible. Our team will have sent you a .xlsx template to be filled with expected dates, amounts, phases and KPIs for the construction progress to be measured. If this data needs to be updated, don't hesitate to send us an email with the updated .xlsx doc.
This document, same as all other documents that might be produced during your collaboration with Imageryst will be found in your assigned Drive folder. If you can not find it, write an email to your assigned Customer Success Representative.
You will also receive a notification via email (see 'Profile') each time a new image from your site has been analysed!
FAQs
-
What if it’s cloudy in my area?
Sadly, clouds can be a major hindering factor in Satellite Monitoring, and it might interfere with results if very recent data is needed. More than 20% cloud coverage might present issues.
-
What if I want data that is currently unavailable?
Some data, such as LiDAR data for certain regions or specific dates for satellite data, might be restricted due to technological limitations. In such cases, contact us and we’ll try to find a tailored solution.
-
How long do I have to wait for the results to be processed?
A project should never take longer than 15’ to be fully processed once executed. In case of ad-hoc satellite image tasking, the normal waiting time is around 1-2hs, but it could take up to 3 days or longer, depending on the cloud coverage and desired resolution.
-
What are the maximum areas I can analyze?
We recommend a max area of 5km², due to the time it might take to process the amount of data, specially for LiDAR datasets. Higher resolution also means less maximum area.